
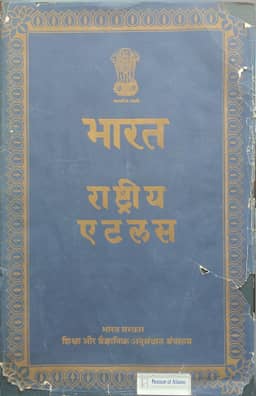
The National Atlas of India
- Publication
- Geographical Review of India
- Pages
- 47-62
India
1968–2009S. P. Chatterjee describes the English National Atlas of India while it was still in preparation. The plan envisaged about 180 plates by 1961, issued in loose-leaf fascicules of roughly 16 plates, covering general, physical, economic and social subjects. He explains the division of work between the research office in Calcutta, the drawing office in Dehra Dun and the Survey of India, which supplied mapping materials and printed the sheets. For maps smaller than 1:1,000,000, the organization selected the Albers equal-area projection after comparative tests. Chatterjee gives particular attention to the population maps: rural population was to be plotted at settlement locations using dots representing 100, 500 and 1,000 people, with agricultural and non-agricultural populations distinguished by colour. Urban circles and rural dots were designed on a common population-symbol scale. He also outlines physical, political, land-use and communications maps under preparation or planned, and identifies continuing shortages of equipment, trained staff and sufficiently detailed mapping data.
View whole-article summary
S. P. Chatterjee describes the development, organization and cartographic work of the National Atlas of India project. His proposal was referred to government bodies in 1953; advisory and executive arrangements followed, and the approved scheme entered the Second Five-Year Plan. The National Atlas Organization was established in 1956. Its objectives included depicting India’s physical and socio-economic geography, supporting planning-region delineation, informing Indian and overseas readers, and employing geography graduates. The Preliminary Hindi Edition, completed before 30 September 1957, contained 26 plates and 103 maps, with English translations of legends and explanatory notes. Drawing and multicolour printing took nine months in cooperation with the Survey of India. Chatterjee explains how uneven official statistics, published and unpublished records, and field observations were collected and recompiled. The Calcutta Research Office analyzed data, tested representations and prepared guide maps; the Dehra Dun Drawing Office produced printing originals and coordinated proofs with the Survey of India. The English edition was still under preparation: about 180 plates were expected by 1961, grouped into general, physical, economic and social subjects and proposed for issue in fascicules of about 16 plates. Technical work included rearranging million-scale coverage and selecting Albers equal-area projection for smaller-scale distribution maps. Physical maps combined additional relief detail, hill shading and compiled regional information; political maps updated boundaries and classified settlements. The population maps used village-site dots representing 100, 500 and 1,000 people, photographic reduction and colour separation, and proportionally scaled urban circles. Chatterjee claimed novelty for the unified rural and urban symbol scale. Land-use surveys were underway in the Damodar Valley, with maps of other representative regions planned.
Related Atlases
Comments
Loading...
0/2000