
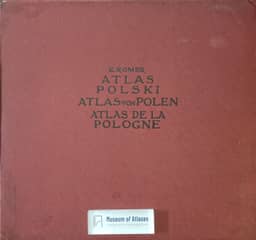
New atlas of Poland
Nowy atlas Polski
- Publication
- Przegląd Powszechny
- Volume
- 129
- Issue
- 1, 2
- Pages
- 167–173, 303–307
Poland · Version 1
1916–1921The article presents Eugeniusz Romer’s account of compiling the Geographical-Statistical Atlas of Poland during the First World War. Romer sought to document traces of Poland’s former unity, compare the effects of partition, and show the demographic, cultural, and economic resources of the Polish lands considered together. Covering historical Poland within its 1772 boundaries and adjoining regions with substantial Polish populations, the work was reported as fully prepared, with 65 maps on 32 sheets and accompanying explanatory texts. Its four thematic sections covered physical and political geography; population, religion, education, and intellectual culture; landownership, agriculture, and livestock; and mining, industry, transport, and cooperative credit. Publication was planned in three installments: a proof of the first was presented, the second had gone to press, and the third was to contain the remaining material. Fr. Stefczyk helped secure funding from Polish savings and loan associations for compilation and publication. Library research, organized office work, and specialist collaborators supplied the material: K. Nitsch worked on language, J. Nowak on geology, J. Rutkowski on large estates, W. Semkowicz on history, and W. Szafer on flora. Each agricultural map required 6,000–8,000 figures; the credit maps drew on over 6,000 societies’ accounts, and the publication maps covered over 127,000 Polish printed works. Romer explains the difficulty of reconciling Austrian, Prussian, and Russian statistics collected at different dates and under different classifications. Counties generally served as mapping units, although elementary education and livestock data had important gaps in comparability. Estimates and graphical classes accommodated some discrepancies; available railway statistics prevented comparable mapping of traffic density on individual lines. For industry, conversion keys linked output value to worker numbers and large-industry employment to total industrial employment. Romer estimated probable error at about 10 percent, reaching 25 percent in extreme cases, and argued that graphical classification limited its impact. He also criticized administrative-area averages for obscuring physical-geographical relationships. Interpolation produced equal-value lines called isarythms, with values located at county seats to retain administrative reference. The first installment emphasized historical boundaries, administration, population, nationality, religion, education, and publishing. Explanatory texts documented sources, dates, methods, and map reading. Romer proposed using the atlas to examine partition-era changes, wartime losses, and the historical routes of material and intellectual culture.
Comments
Loading...
0/2000