
The national atlas of Hungary
L'Atlas National de Hongrie
- Publication
- Studies in Hungarian Geographical Sciences
- Pages
- 71–84
Hungary · Version 1
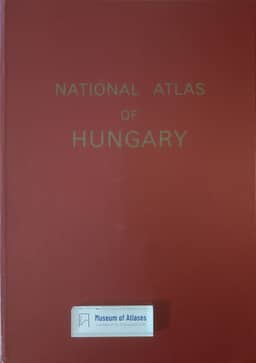
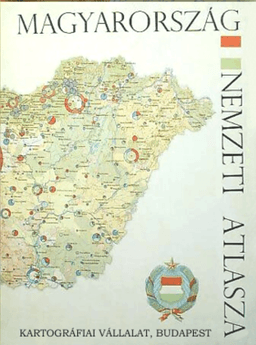
1967Sándor Radó describes the preparation of the National Atlas of Hungary, authorized in 1958 by the National Office of Geodesy and Cartography. He presents it as a comprehensive scientific reference and an instrument for national economic planning, responding to gaps in Hungarian cartographic coverage and to international coordination of national atlases. Its guiding principles are geographical synthesis, up-to-date knowledge, and subjects useful to science and practice. The program was developed with the economic-geography department of Budapest’s Karl Marx University, circulated with a reduced mock-up to scientific and state institutions, and reconsidered by the Office’s Cartographic Commission. Radó explains that some specialist proposals were modified to emphasize connections across disciplines and practical needs. Specialized cartographers at the Hungarian Cartographic Enterprise would prepare the maps, with review by competent institutions. Historical comparisons and explanatory texts were intended to limit obsolescence and improve public accessibility. The planned volume has 96 pages measuring 34 × 48 centimetres, including 88 map pages arranged in thirteen chapters. Physical geography accounts for 36 percent of map pages, economic geography 55 percent, and cultural and administrative subjects 9 percent. Detailed relief and regional maps precede a sequence moving from natural conditions to agriculture, industry, transport, trade, population, and social and cultural conditions. Radó emphasizes meteorological maps relevant to agricultural production, including temperature and precipitation probabilities. Much of the article addresses economic mapping. Compilation requires extensive statistical collection, adjustment for territorial and administrative changes, and data at commune level for agriculture and establishment level for industry. Proposed combined maps relate crop distribution to optimal natural conditions and use intersecting hatching to show cultivated area and yield together. Historical maps examine changes in landholding and production. Agricultural synthesis uses gross production value; industrial mapping selects branch-specific indicators and geometric symbols for comparable magnitudes. Radó also notes the sensitivity of industrial value measures to prices. He hopes these representations will help planners assess regional imbalances and improve the territorial distribution of productive forces.
Related Atlases
Comments
Loading...
0/2000